Coach is a product that I have been working on during my minor in Interface and User Experience Design. The project was centred around the question: ‘How could environmental data start to influence when people go for their outdoor activities?’ I learned to design for a specific audience and used new interactions like a conversational interface.
The project was initiated by the Dutch agency CLEVER°FRANKE. Against the backdrop of globalization, cities are increasingly challenged to maintain sustainable economic development and a livable urban environment that ensures quality of life for its inhabitants. Whether big or small, it will be ‘smart cities’ making the difference in the future. Part of these smart cities will be sensor networks that continuously monitor the quality of the environment. The goal of this project was to design how environmental data could influence when and where people go for their outdoor activities.
In a period of 4 months, the team and I researched how to communicate the various available measurements and how to allow people to choose what variables to take into account. One of the biggest challenges was how autonomous the product was going to be.
The concept
The project started by conducting interviews with different experts on environmental data and finding a suitable scope for the project. After presenting the insights and to our key stakeholders we decided to focus on a specific target group: asthmatics. We created an application that provides predictions and makes data tangible as is shown in the product video I created.
Testing interactions
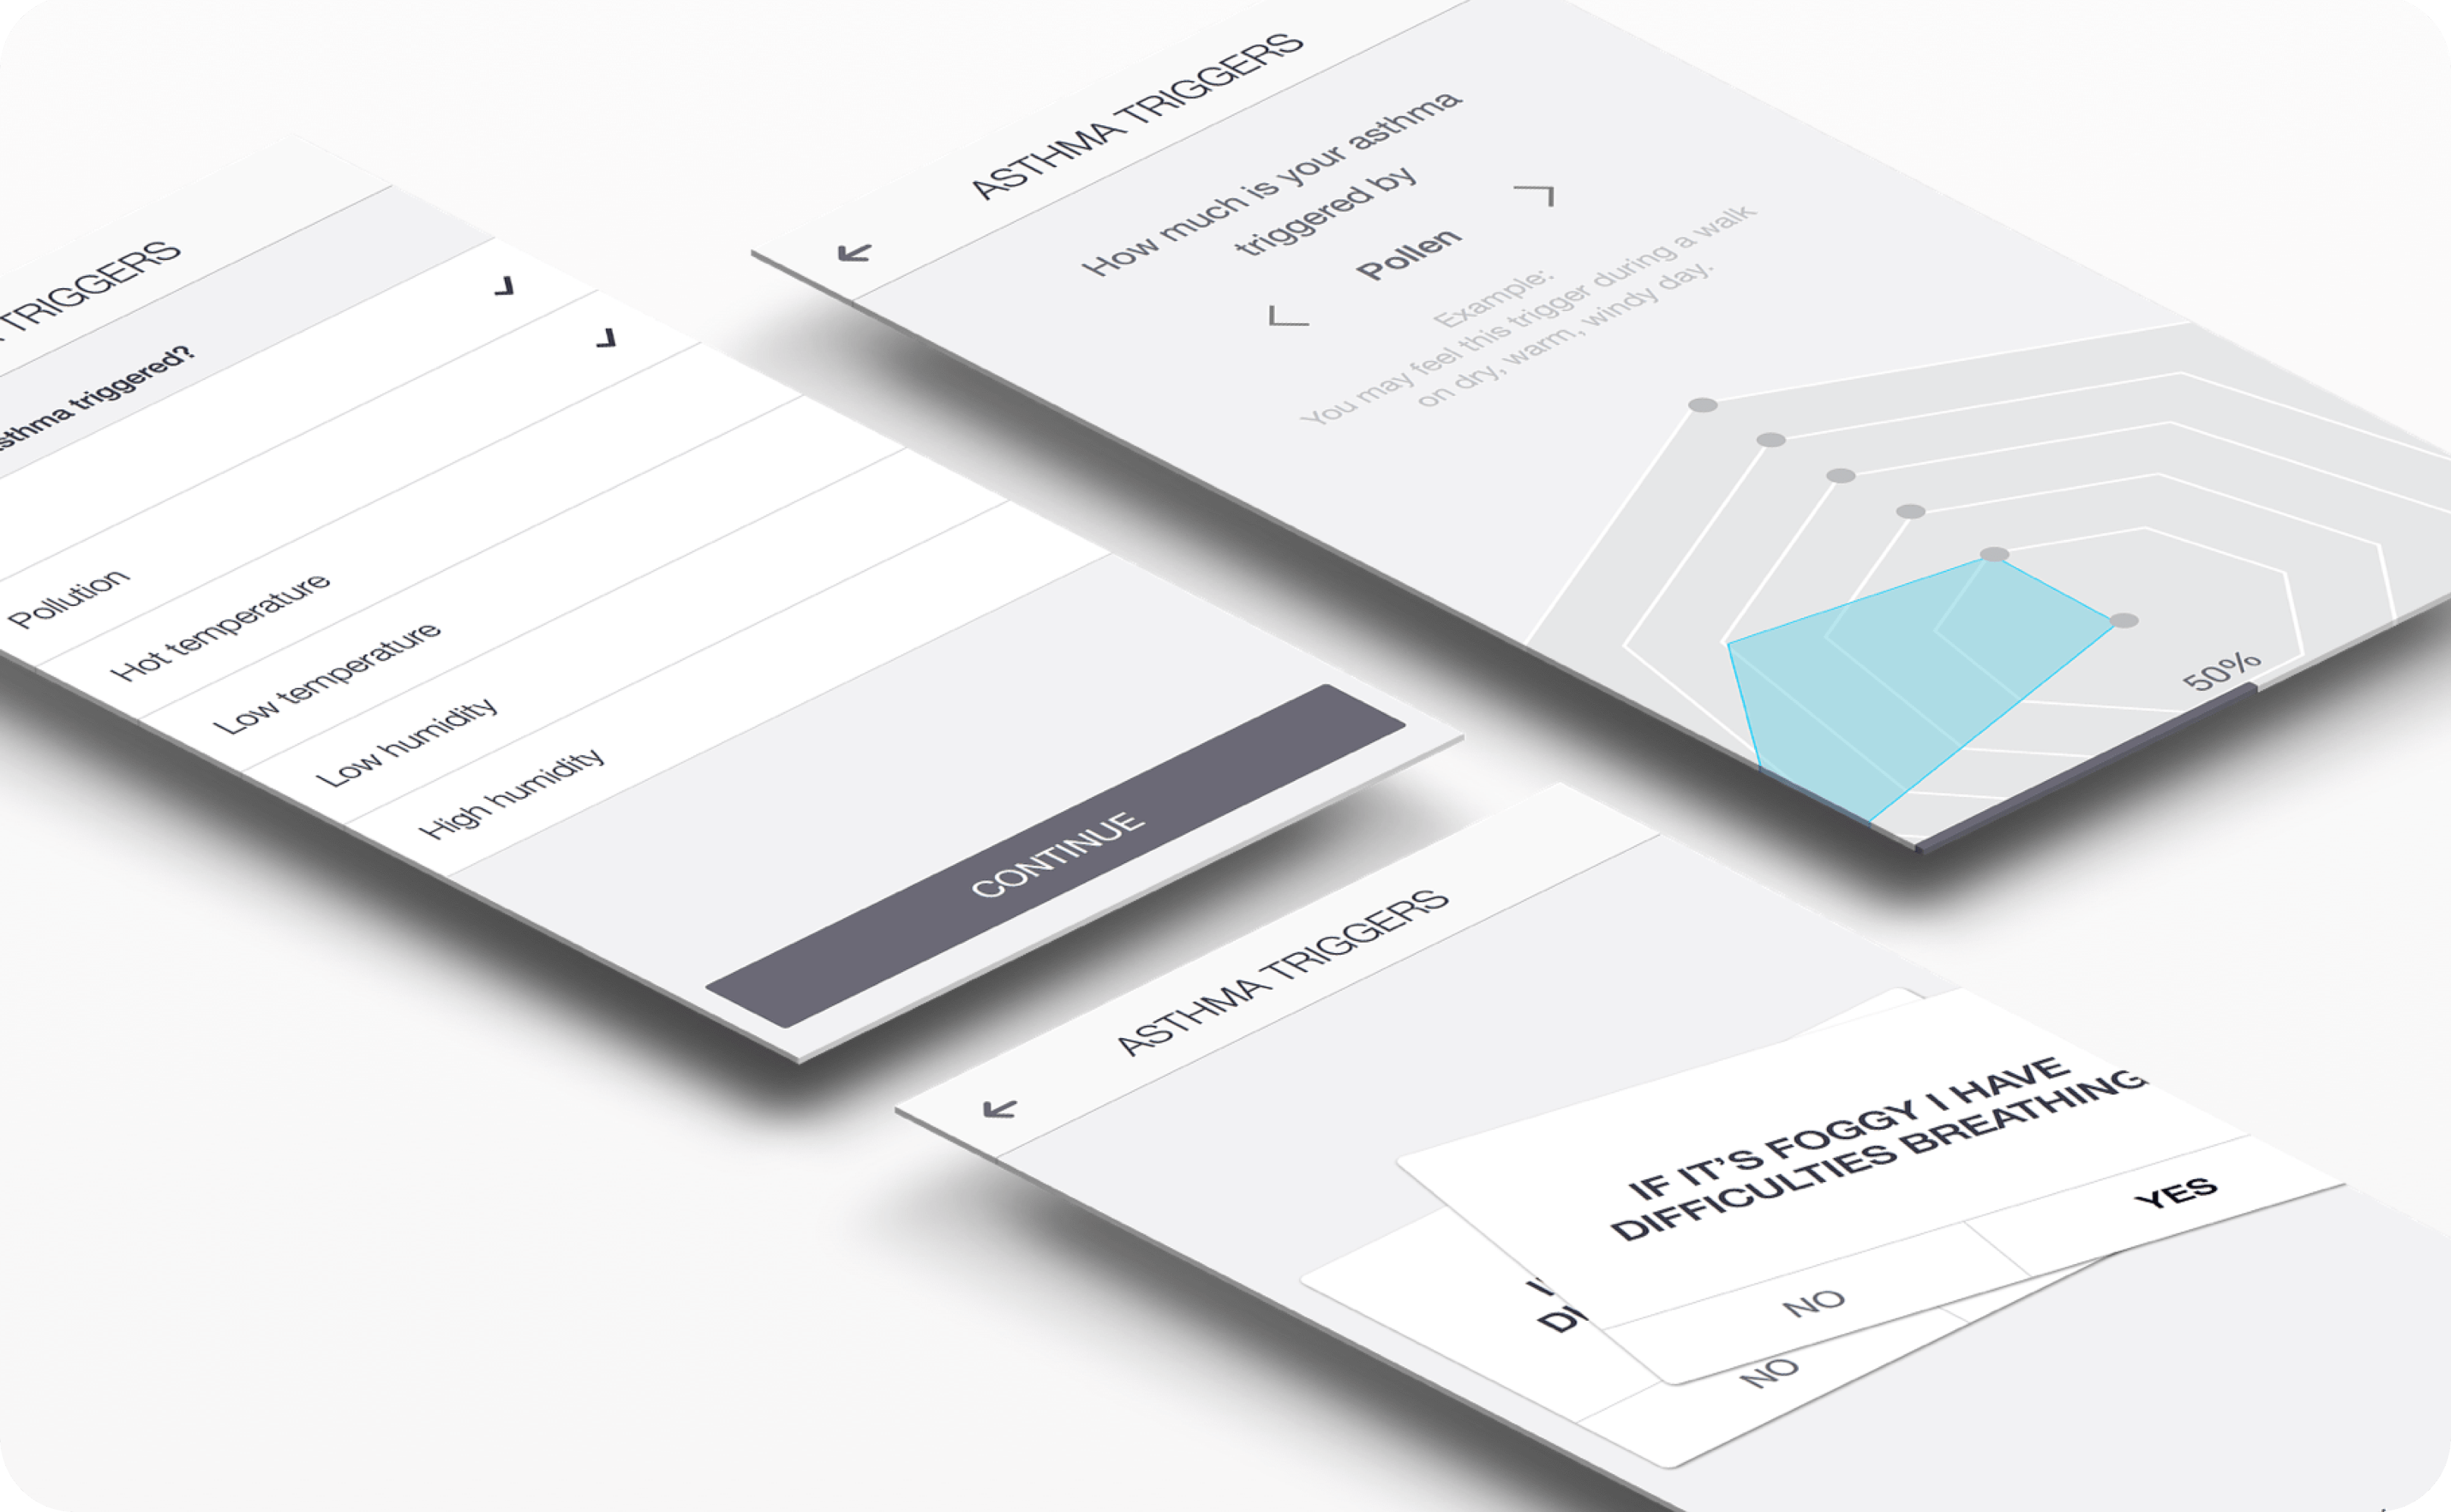
The application consists of different interactions which were the result of different user tests. To find out the best way to ask asthma triggers, for example, we did multivariate testing. We tested three ways of approaching the trigger question. The first one was selecting the most relevant triggers. Another option was to swipe trigger statements on relevance. The last option was a rating system for each separate variable. We made a link which sends the participant to a random option. The last question was to relate to one of the three types of asthma. In this way, we could conclude which approach is most suitable.

Designing a conversation
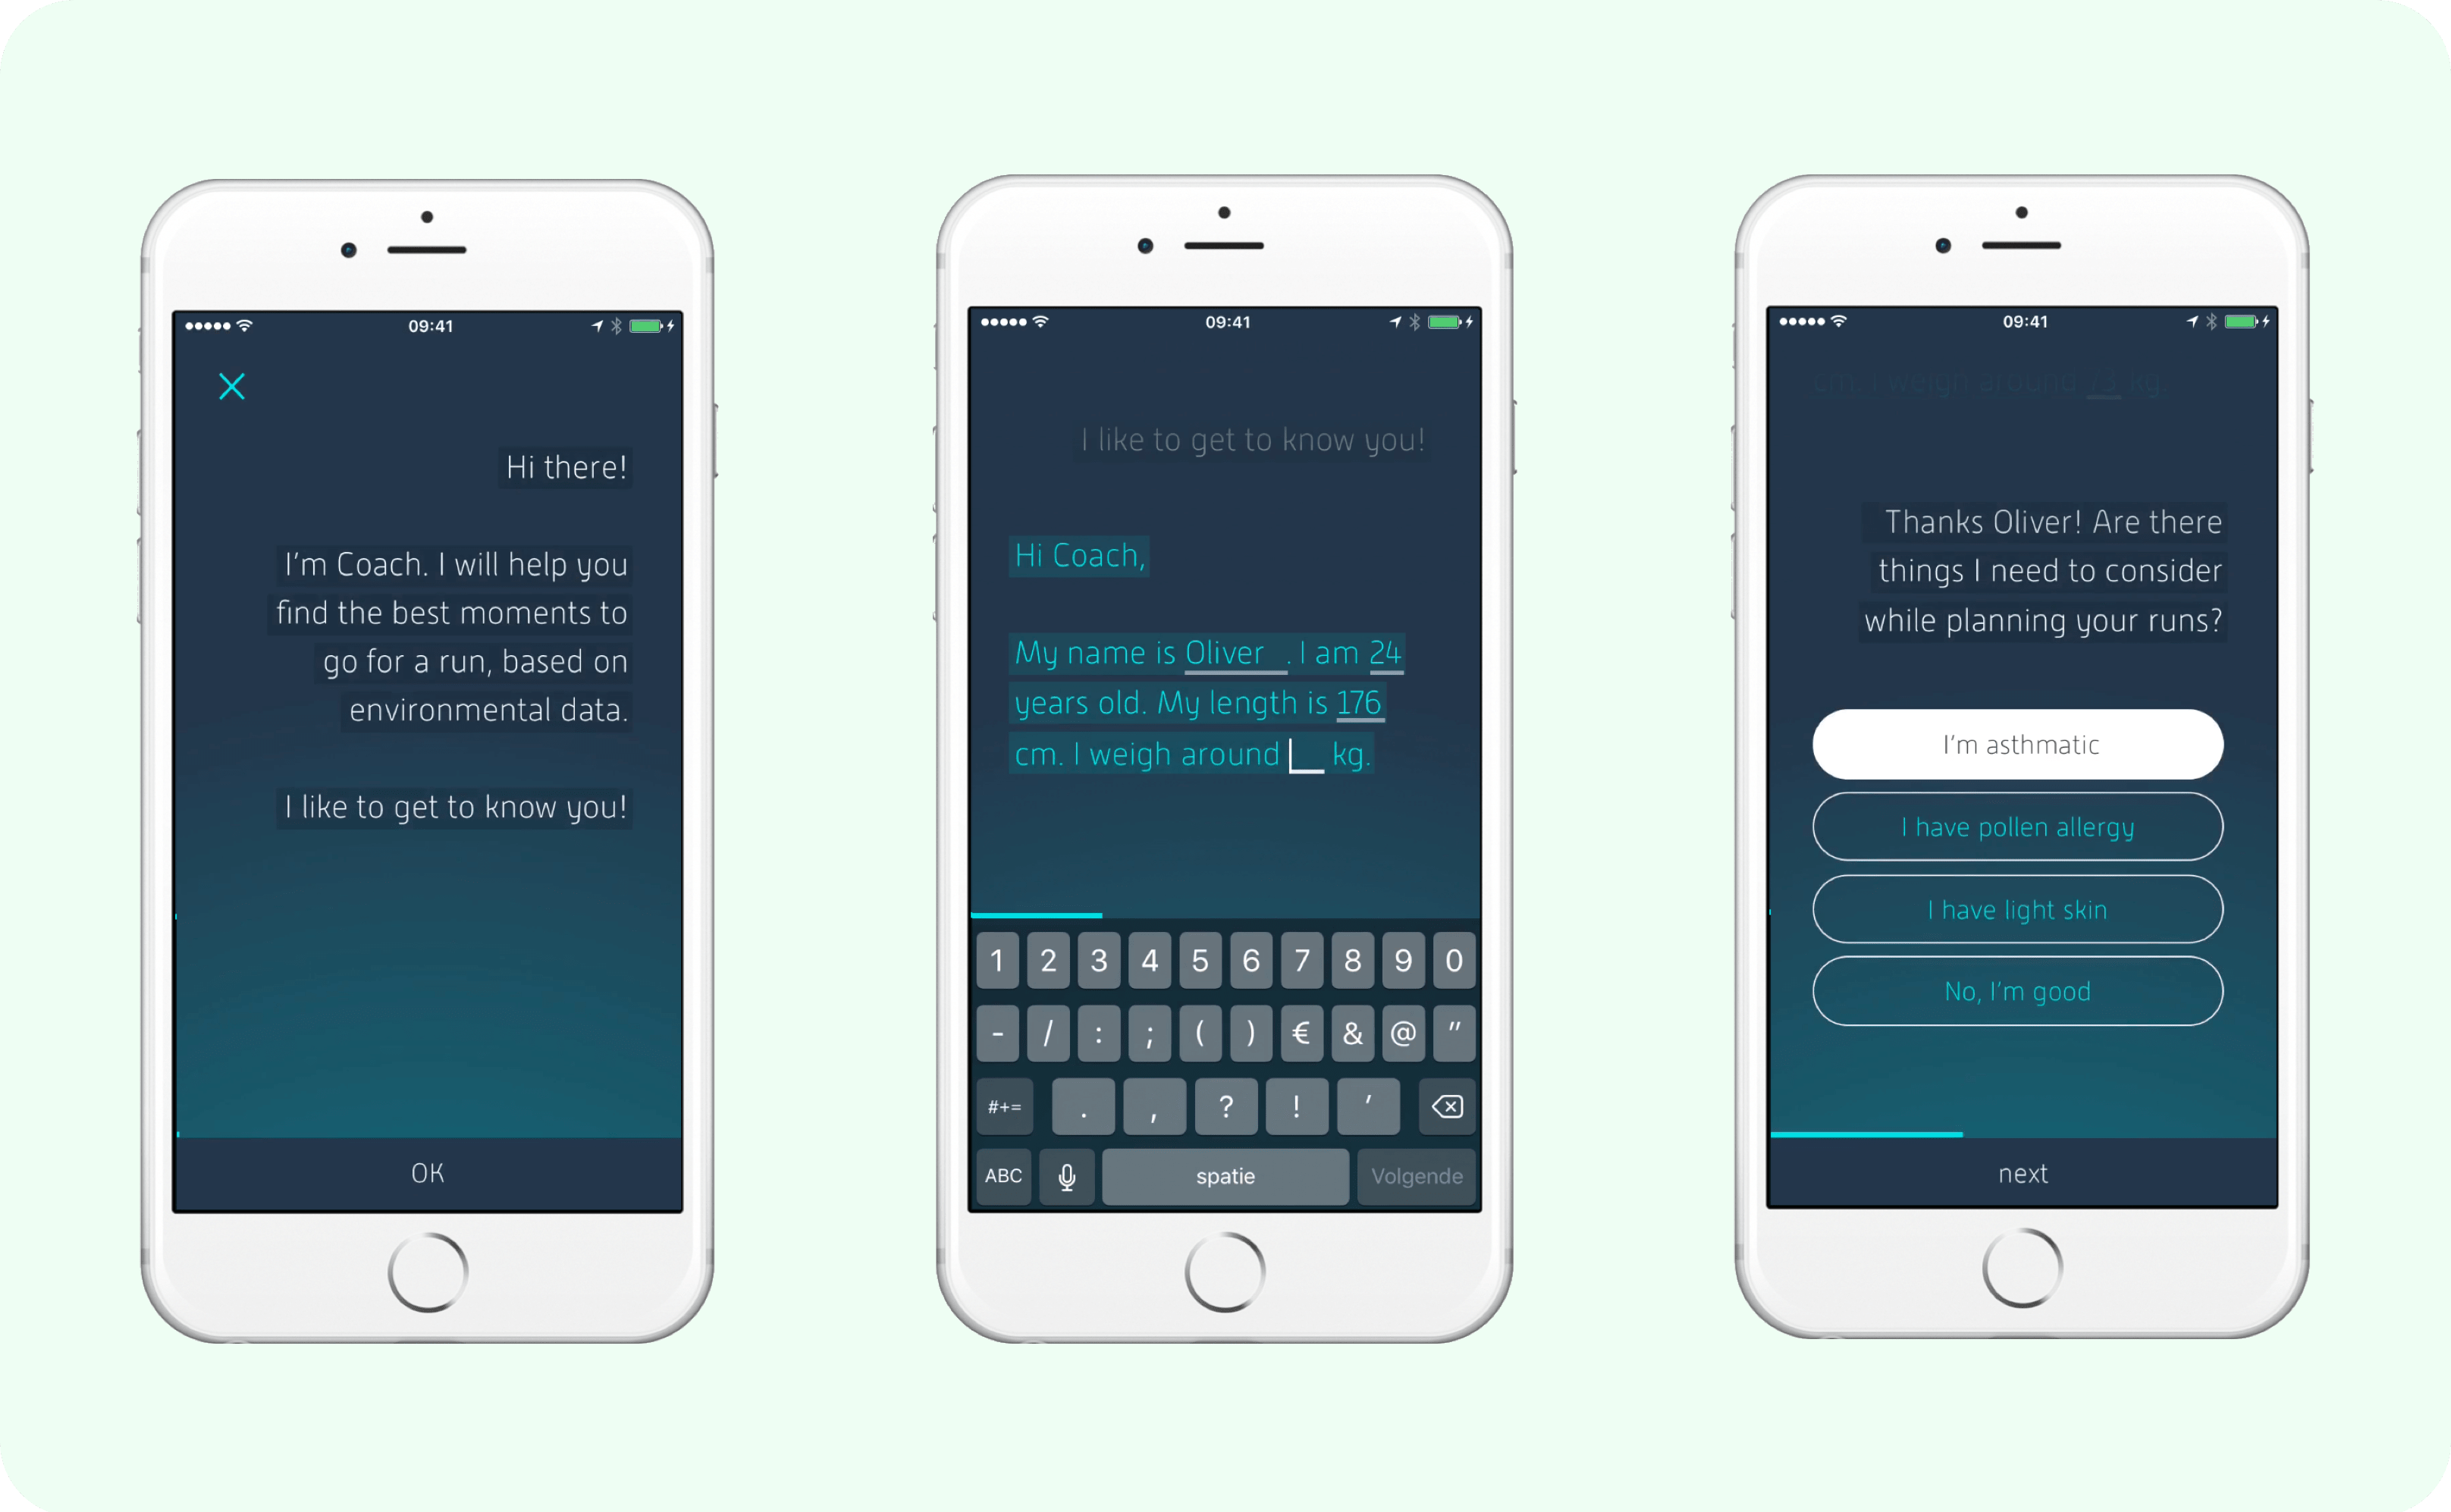
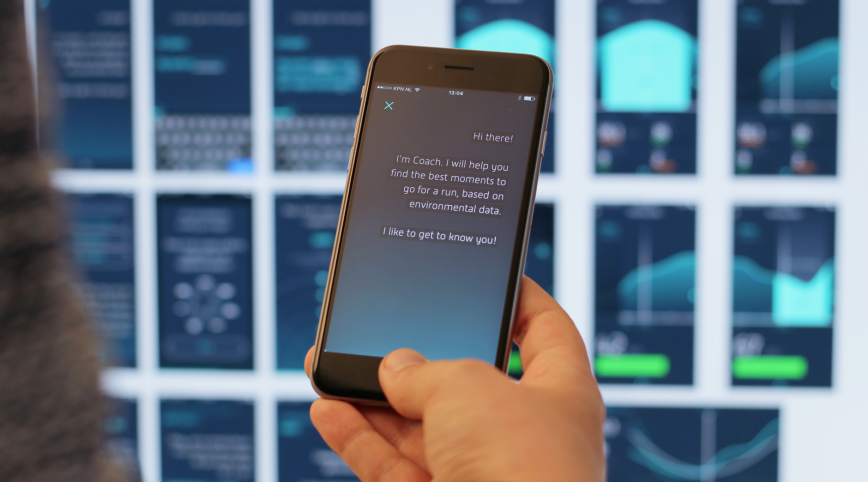
During the design of the onboarding, the aim was to start a relationship with the user. Furthermore, the data that Coach needs to provide the user with accurate suggestions might be overwhelming. With this in mind, we designed a conversation in which the user and Coach get to know each other step-by-step.

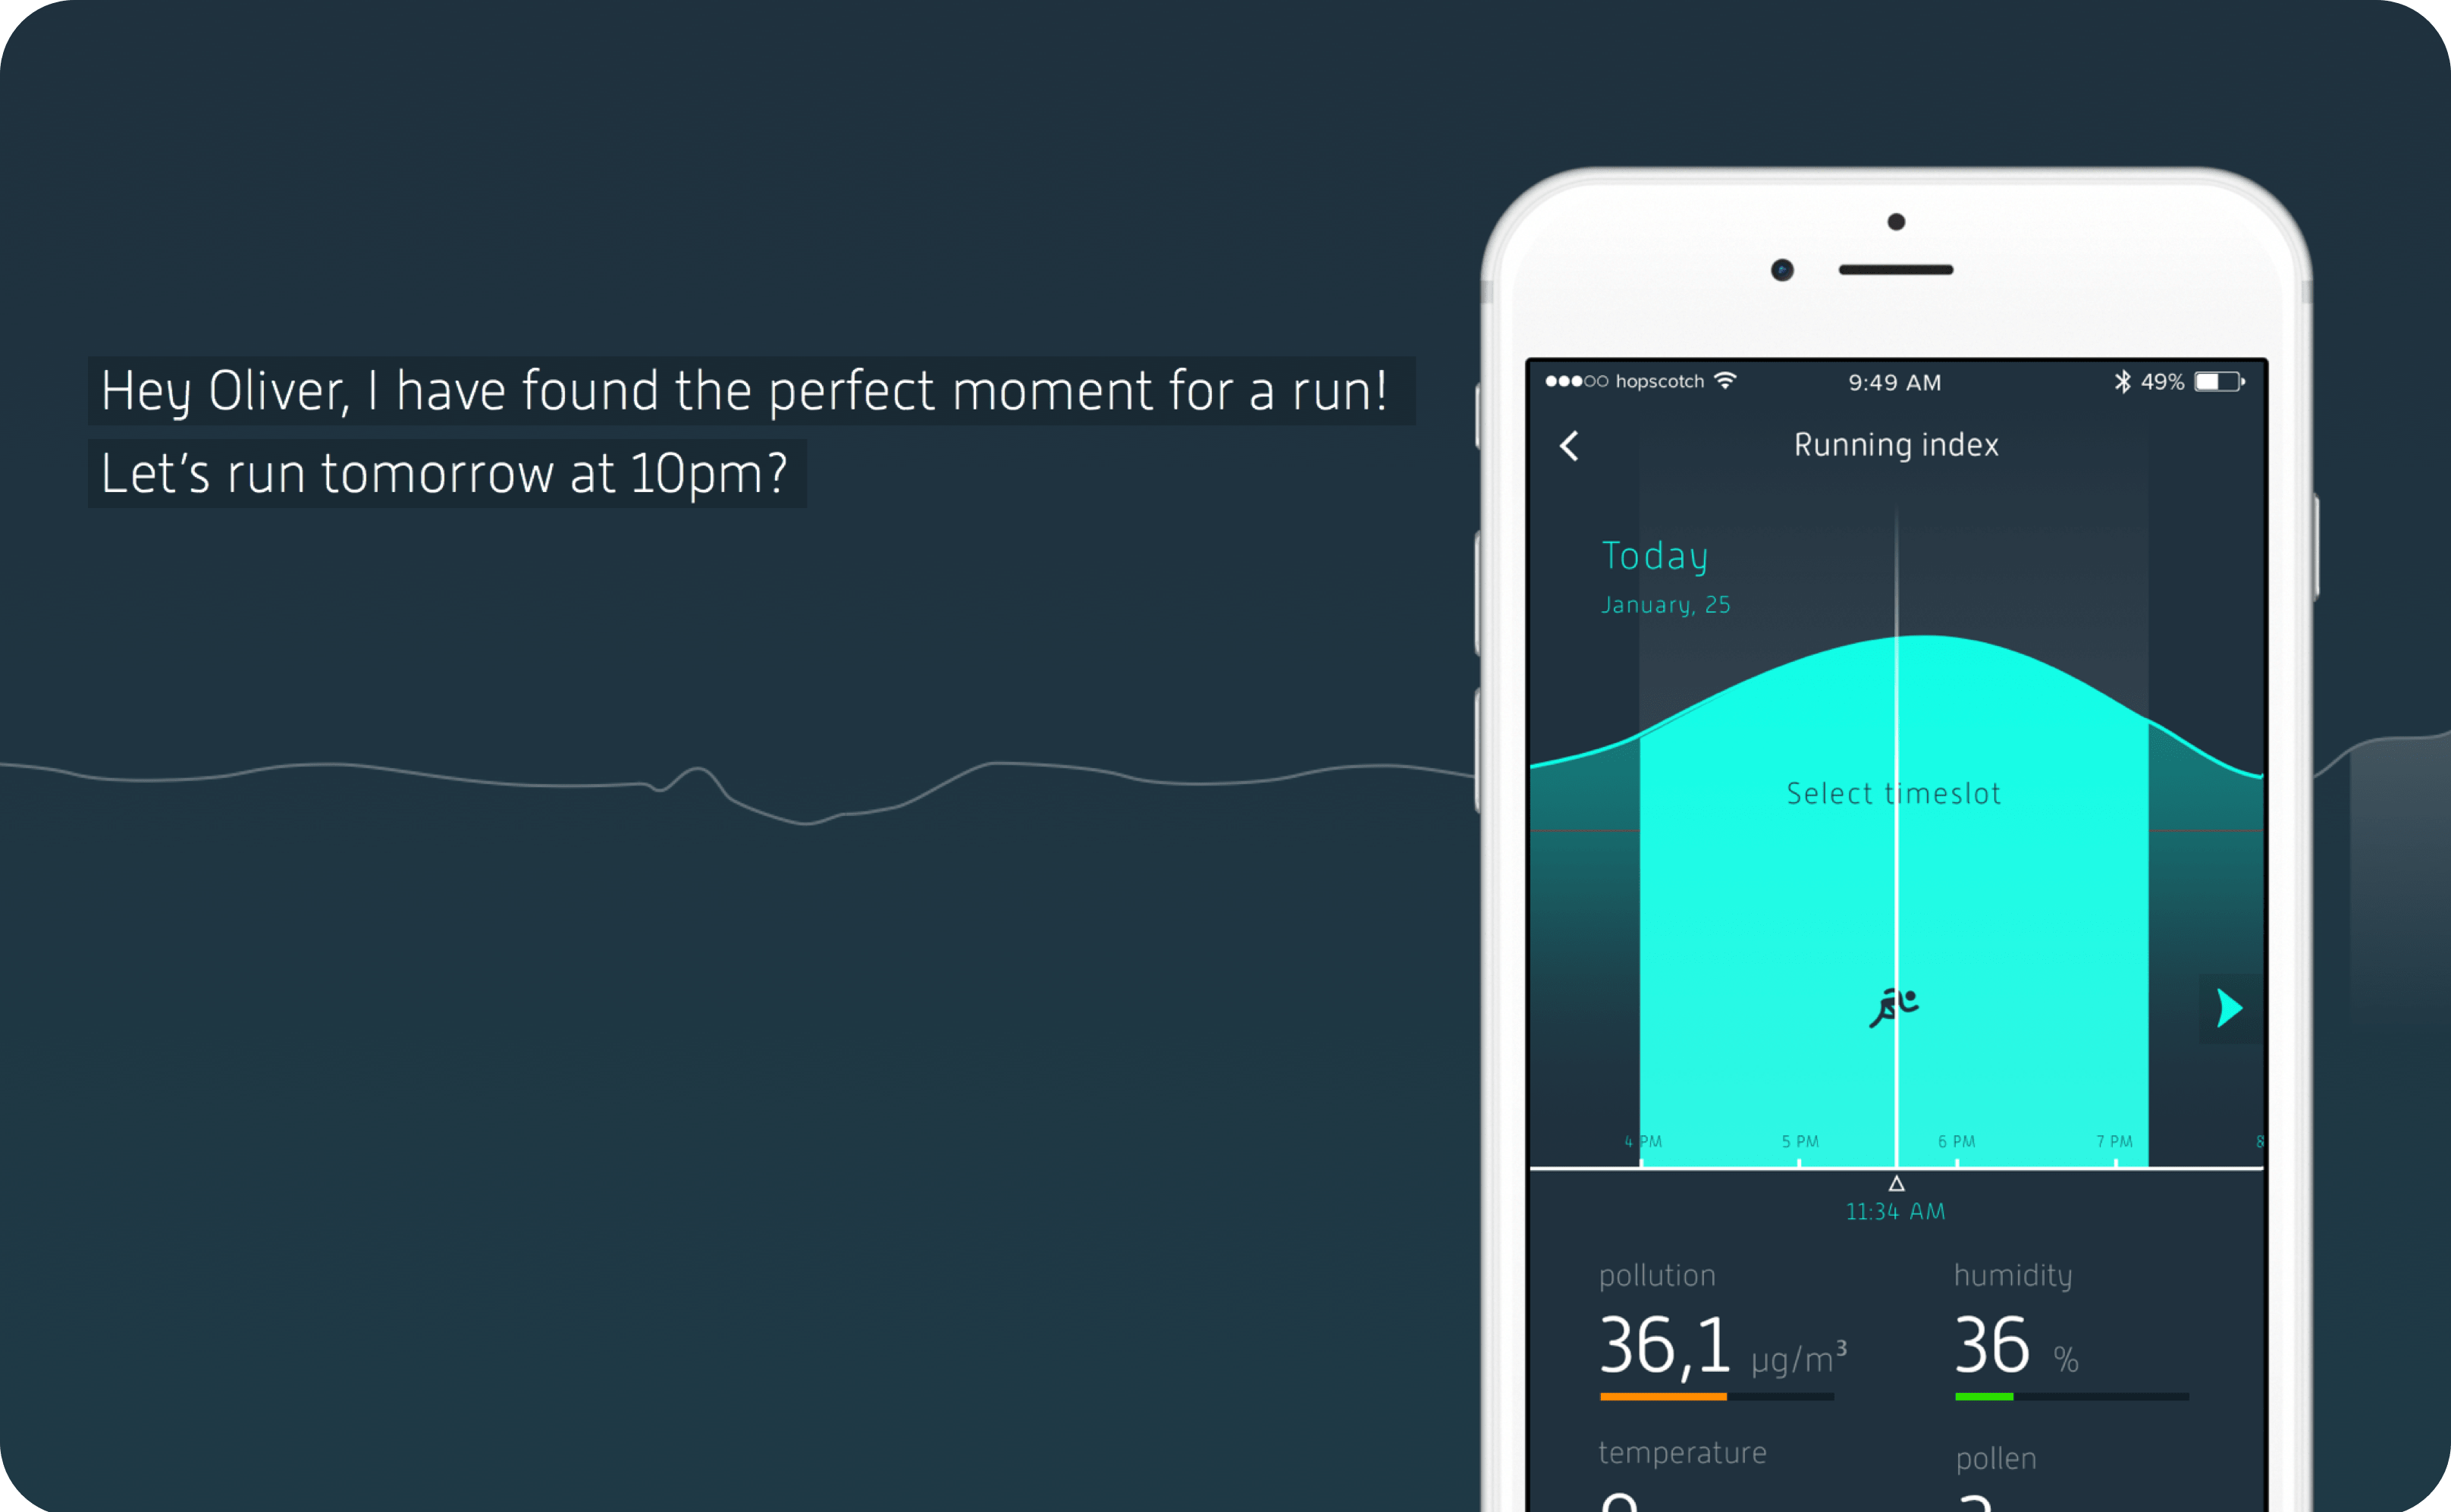
Users get notified about their best running moment and personal data will be shown in this first level of information. This index combines real-time data with the trigger values received during the intake. The best running timeslots will be highlighted.

Result
The case study was presented to the case owner, and the Lung Foundation and the Netherlands National Institute for Public Health and the Environment. The latter started to use Coach as an example in different presentations about the possibilities open data can bring.


